What Is Data Consolidation In Excel

There’s something genuinely satisfying about taking a messy pile of numbers from different spreadsheets and turning it into one clean, meaningful summary. That’s the quiet mag...

There’s something genuinely satisfying about taking a messy pile of numbers from different spreadsheets and turning it into one clean, meaningful summary. That’s the quiet magic of data consolidation in Excel. It’s a tool that feels a bit like solving a puzzle—only the reward is a clear, actionable picture of your information. Whether you’re a project manager tracking budgets or a small business owner combining monthly sales, this feature saves you from tedious copy-pasting and helps you spot trends without the headache of manual errors.
The main purpose of data consolidation is exactly what it sounds like: pulling data from multiple ranges or sheets into a single location. Instead of flipping between tabs or files to compare numbers, you can automatically combine them using functions like SUM, AVERAGE, or COUNT. For instance, imagine you have separate worksheets for each quarter’s expenses—consolidation lets you merge them into a yearly report with just a few clicks. This is a game-changer for team leaders who need to roll up figures from different departments, or for freelancers tracking income from multiple clients. The benefits? Less time spent on drudge work, fewer mistakes, and more trust in your final numbers.
You might already recognize a common variation of this: the Consolidate tool under the Data tab. It’s built for situations where your source data has the same structure—like if every sheet has “Sales” in column A and “Profit” in column B. Another variation is 3D referencing, where you write formulas that pull from the same cell across multiple sheets (e.g., =SUM(Jan:Dec!B2)). This is ideal for dynamic reports that update automatically when you add new sheets. A more advanced example is using Power Query to consolidate files from different folders—perfect if you’re dealing with raw data exports that don’t match up neatly. Each method has its sweet spot, but they all share the goal of turning chaos into clarity.
Must Read
Getting started is easier than you might think. First, make sure your source data is organized consistently—each range should have the same layout (e.g., row labels in the first column and values in the same order). Then, open a new worksheet, go to the Data tab, and click Consolidate. In the dialog box, choose your function (usually SUM), and click the “Add” button to select each range from different sheets. Don’t forget to check the boxes for Top row and Left column if you want labels included. This simple process can consolidate up to 255 separate ranges—imagine manually adding that many!
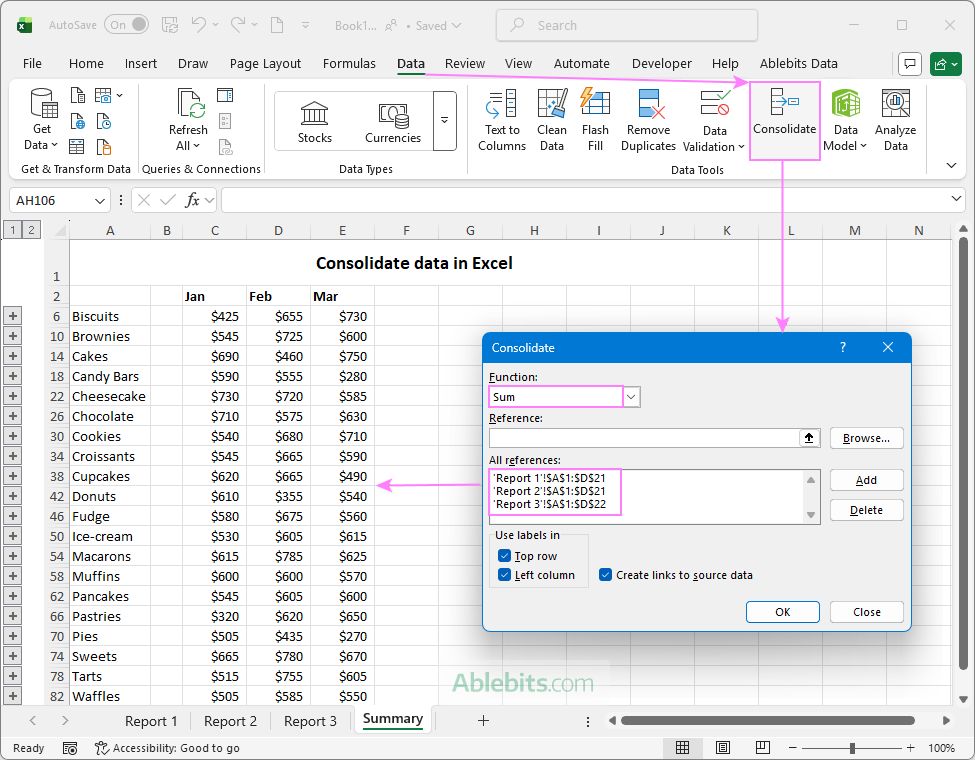 How to consolidate data in Excel: multiple files, sheets, columns, cells
To make the most of it, always test your consolidation on a small dataset first. A quick tip: use named ranges to make your references easier to manage and less error-prone. Also, if your data changes often, consider using Power Query instead of the basic Consolidate tool—it lets you refresh the combined table with one button, so you’re never stuck with stale numbers. Another handy trick is to create a backup of your original data before consolidating, just in case you need to trace back to the source. Remember, the goal is to work smarter, not harder, so automate where you can.
Ultimately, data consolidation in Excel is about gaining control over your information without needing to be a spreadsheet wizard. It’s practical for everyone from accountants to hobbyists running a small club’s membership dues. By mastering this feature, you free up mental energy to focus on analyzing the numbers instead of wrestling with them. So next time you’re facing a heap of data, give consolidation a try—you might just find that organizing numbers can be oddly enjoyable.
