How To Calculate Cost Of Goods Sold

For many entrepreneurs and small business owners, there is a quiet, deeply satisfying moment of clarity when the numbers finally make sense. It’s the feeling of moving from gu...
For many entrepreneurs and small business owners, there is a quiet, deeply satisfying moment of clarity when the numbers finally make sense. It’s the feeling of moving from guesswork to genuine knowledge, from hoping you are profitable to knowing you are. At the heart of this financial clarity lies a single, powerful metric: the Cost of Goods Sold (COGS). Understanding COGS isn’t just an accounting chore; it’s the key to unlocking the true story of your business. It tells you how much it actually costs to produce the product you sell, transforming a chaotic pile of expenses into a clear map of your operational efficiency. This knowledge isn’t for the accountant alone—it empowers you to make smarter decisions about pricing, inventory, and even which products are worth your time.
The core purpose of COGS is to separate the direct costs of making your product from all other business expenses. Think of it as the precise, calculable price tag on the stuff you sell. For a bakery, that means the flour, sugar, eggs, and the baker’s labor that goes into a single loaf of bread. For a software company, it’s the server costs and the payment processing fees for a subscription. The magic of COGS is that it allows you to calculate your gross profit—the revenue left over after covering these direct costs. This number is your first, most honest indicator of whether your product has a viable margin. Without it, you are flying blind, potentially mistaking high sales for actual profitability.
The benefits of mastering COGS ripple through everyday business life. Consider a small candle maker who notices her profits are shrinking despite selling more candles. By calculating her COGS—the wax, wicks, fragrance oils, and jars—she discovers that the cost of a specific imported fragrance oil has tripled. This isn’t a vague problem of “rising costs”; it’s a specific, actionable insight. She can now choose to raise the price of that candle, switch to a cheaper scent, or run a promotion on her lower-COGS bestseller. In this scenario, COGS transforms her from a passive victim of market forces into an active, strategic manager. It gives you the data to confidently raise prices, negotiate with suppliers, or discontinue a losing product.
Must Read
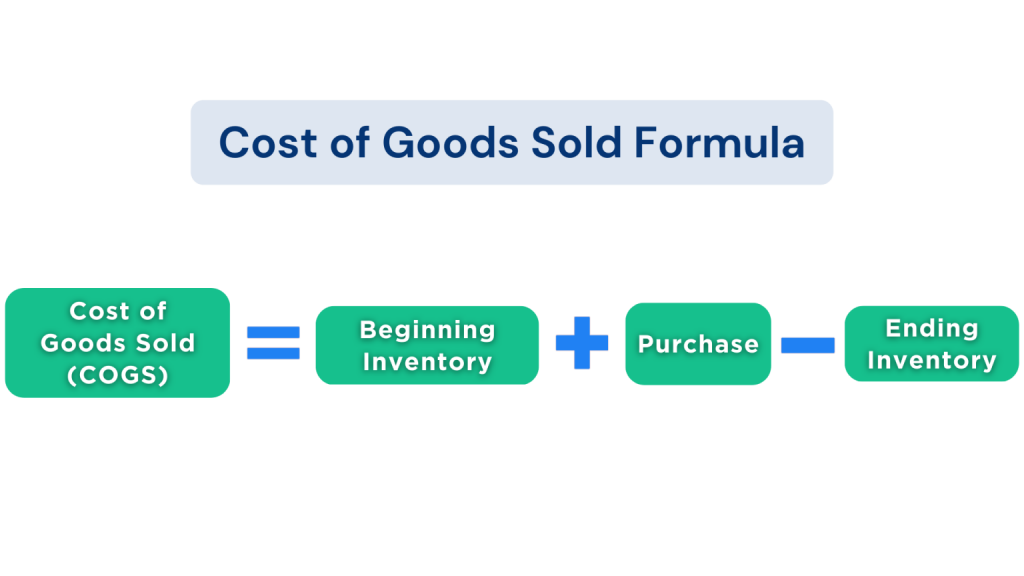
So, how do you actually calculate it? The formula is refreshingly straightforward: Beginning Inventory + Purchases – Ending Inventory = COGS. Let’s break that down with a simple example. Imagine a small bookstore. On January 1st, they have $10,000 worth of books on their shelves (Beginning Inventory). Throughout the month, they buy $5,000 more stock (Purchases). On January 31st, after all sales, they count $7,000 worth of books remaining (Ending Inventory). Their COGS for January is: $10,000 + $5,000 – $7,000 = $8,000. That $8,000 is the direct cost of the books they actually sold during the month. It’s a clean, auditable number that strips away the complexity of daily sales.
To apply this to your own business, start by gathering three key pieces of data. First, conduct a physical inventory count at the beginning of a period (say, January 1st). Second, meticulously track every purchase of inventory or raw materials during that period—keep all receipts and invoices. Third, count your inventory again at the end of the period (January 31st). The difference reveals your COGS. A crucial nuance: only include costs directly tied to production. For a manufacturing business, this includes raw materials and direct labor. Do not include marketing, rent, or salary for the sales team—those are operating expenses, not COGS. Getting this distinction wrong can make a profitable business look like a failure, or vice versa.
 Cost Of Goods Sold Formula How To Calculate Cost Of Goods Sold: Easy
For a simple exploration, use a spreadsheet. Create a column for your beginning inventory value, one for your total purchases, and one for your ending inventory. Run the formula for three different months. You might be shocked by the variations. A month with a big push on a high-cost product could show a much higher COGS, explaining why cash flow felt tight. Alternatively, a month where you sold through cheaper items might reveal a pleasant profit spike. This exercise alone—the simple act of calculation—turns abstract data into a powerful, personal narrative about your business’s health. It transforms a number on a sheet into a story of your decisions, your suppliers, and your customers.
Finally, a simple tip for the budding analyst: standardize your process. Use a consistent method for valuing your inventory, such as FIFO (First-In, First-Out) or LIFO (Last-In, First-Out). Don’t jump between methods as it will muddle your trends. A second tip is to track COGS as a percentage of revenue. If your COGS ratio is 40%, you keep 60 cents of every dollar as gross profit to cover your other expenses. If that ratio starts climbing, it’s an early warning. Calculating COGS is not just about finding a number; it’s about building a muscle for clarity and control. Once you master it, you unlock a level of financial intuition that turns business from a gamble into a science.

